October 8, 2021
The Ideal QA Process in Digital Advertising
PPC seasonality is an important factor to examine when you first take over a new account. For example, most ecommerce companies experience a large increase in spend and revenue around the holiday retail period. There can also be swings and dips around many other times of the year and it’s important to know those are coming so you can plan accordingly. Seasonality can affect everything from traffic and budgets to CPCs as competitors may get more or less aggressive with their bids depending on the time of year.
Before starting work on a new account, there are a number of reports you can generate. These will give you a better idea of what impact seasonality had in the past as well as what impact it will have in the future. The most obvious place to start is the AdWords graph. You can set your date range for the past year or longer and get a top-level view of overall performance for clicks, cost, and other metrics. Unfortunately, you can’t see revenue or ROI on the AdWords graph, but it still can point you in the right direction when looking at traffic and volume trends.
Below are three advanced reports that will provide even more detail and insight into seasonality.
View by Month in AdWords’ Dimension tab
This is a great way to see general volume and budget trends. Not only can you look at recent months as a benchmark, you can look at last year’s data to project what this upcoming holiday season might look like. Of course, every year will be a little different, but you can use this data to plan out if you expect to see a 30% increase in volume or a more conservative 10% swing. That info can help you adjust everything from budgets to bids, and you can be prepared ahead of time and not caught by surprise.

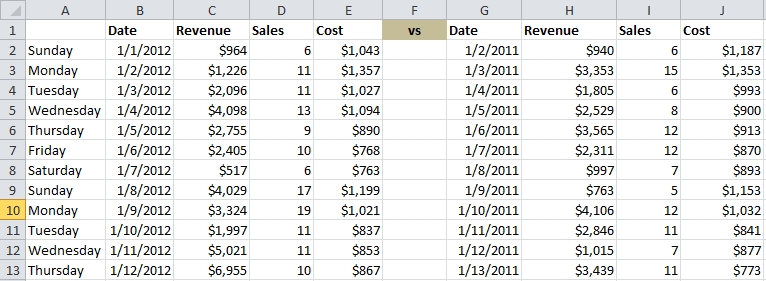
Same Day vs Last Year Excel Report
These are reports we often use for our ecommerce clients to compare metrics for a certain day this year vs that same day last year. For example, if I wanted to compare data for the Monday after Labor Day, I would use 9/3 in 2012, but the date would be 9/5 for 2011. This is important because the day of the week can have a large impact so you want to make sure you are comparing Monday vs Monday as opposed to another day of the week where performance can vary dramatically.
We’ve also seen similar reports generated by clients that they use to keep track of PPC costs and revenue. These reports can be especially valuable for companies where PPC spend is responsible for driving most of their total online revenue. By looking at comparative data, you can get a sense of where you stack up vs last year’s performance. This can be incredibly helpful with a new account since it provides context and benchmarks for measuring the impact of your optimization efforts. If November is usually a stellar month for the client, then you want to be hitting similar or better benchmarks this year. If you are only comparing your performance to this year’s October data, you might think the account is doing great, but it could be doing drastically worse than last year.
Custom Report in Google Analytics for AdWords Cost vs Total Revenue
Here is another report that can help with seasonality and other analysis. This one can be set up as a Custom Report in Google Analytics. What’s really useful about this report is that you can plot AdWords cost vs Total Ecommerce Revenue on the same graph in Google Analytics (this assumes you have your AdWords account linked to GA and that you are tracking revenue in GA). For an ecommerce company where PPC represents 75%+ of marketing spend, this is a great way to correlate changes in PPC spend with changes in overall ecommerce revenue. PPC can often boost other channels like organic traffic and email marketing and this report can provide some high-level insight.
Create this report by navigating to the Custom Report tab in Google Analytics. You will want to select Revenue and Transactions from the Conversions drop-down as well as Cost from the Advertising drop-down. These will be your metrics. You can also select others if you wish. At this point, you will need to select a Dimension Drilldown. Date and other time selections in the Other drop-down are useful.

Now you can hit ‘Save’ and you will have your Custom Report where you can compare Adwords Cost and Total Revenue on the same graph. Also, here is a link that you can use to import this simple Custom Report into your Google Analytics account:
https://www.google.com/analytics/web/permalink?uid=otvOR9k3S8G377BvotePCw

Overall, seasonality and trends are extremely important in PPC. When you start out with a new account, these reports can help you achieve future success by digging into past performance.
