October 8, 2021
The Ideal QA Process in Digital Advertising
We all know how useful Excel formulas are for PPC analysis. Here are three more formulas guaranteed to impress even the savviest Excel pros.
The INDEXMATCH function is an incredibly powerful lookup tool that can be used across rows and/or columns, unlike VLOOKUP, which only works for columns. INDEX and MATCH are separate functions, but they’re almost always used in conjunction.
Formula: =INDEX(range, MATCH(lookup_value, lookup_range, match_type))
The INDEX function takes a range of rows or columns, and the row or column number to search across, then returns the value of the corresponding cell. The MATCH function takes a lookup_value, searches for that value within a specified row or column range, and then returns the cell number where that lookup_value occurs. By combining these functions, you can find the cell number of any lookup_value using the MATCH function, then find the corresponding value using the INDEX function. This might sound complicated, so let’s take a look at an example:
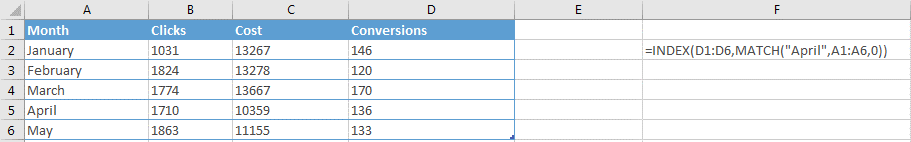
In this formula, the MATCH function will return the cell number corresponding to the lookup_value of “April” within the range of A1:A6, which is cell 5. The INDEX function then returns the value of cell 5 in the range of D1:D6, which is 136.
The INDEXMATCH function becomes much more useful as the size of the dataset increases. All you have to know is the lookup_value you want to search for, and the function will return the value from the corresponding row/column.
The OFFSET formula is a simple lookup function. Simply choose a reference cell and specify the number of rows, then columns, to move from the reference cell. This will return the value of that cell. There are optional criteria that allow you to return a range instead of just a single cell, but for now we’ll leave these blank.
Formula: =OFFSET(reference, rows, cols, [height], [width])
Below is an example:
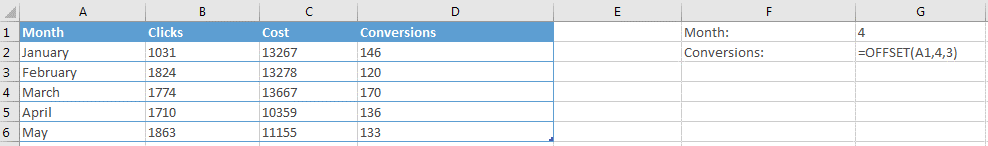
Here, we ask Excel to start at cell A1, move 4 rows down and 3 columns across and return the value. This is the number of conversions in April, which is 136. Excel can also search up and to the left of the reference cell using negative values. That would not work in this case, however, since our reference cell is the upper leftmost cell in the sheet.
We can also use references within the OFFSET function, as with the following example:

If the value in G1 is updated, we won’t have to update our OFFSET formula in G2 — it will simply pull the conversion value from the new row.
SUMIFS is a very powerful tool for summarizing segmented data, which is central to PPC analysis. It allows you to sum data from a row or column, but only if criteria that you specify are met for corresponding cells in other rows or columns. You can specify as many criteria ranges and criteria as you want.
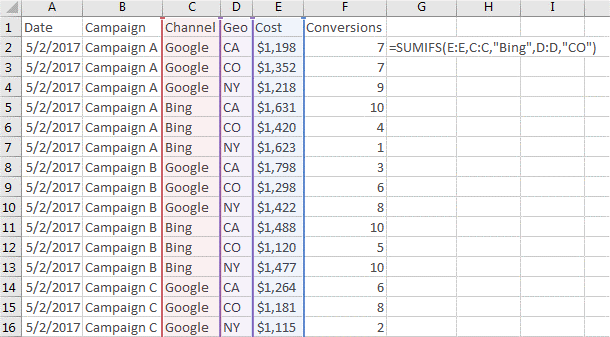
Formula: =SUMIFS(sum_range, range1, criteria1, [range2], [criteria2],…)
Let’s say you want to aggregate spend across an account by channel and location for multiple days. Here’s an example where we’re summing cost from cells in column E (sum_range), but only if the corresponding values in columns C and D (ranges) are “Bing” and “CO,” respectively (criteria):
The SUMIFS function becomes more powerful as the size of your data increases and the number of segmentations required increases. If you were building a report to see recent performance by location, business unit, channel, and campaign type, SUMIFS would be the best way to go.
Pivot tables function similarly, but if you’re building any additional formulas based on the data (like monthly projections), then you would need to use the GETPIVOTDATA function. This adds an additional level of complication, however, not to mention cell references work differently within pivot tables. Due to this, SUMIFS would be the simpler way to go. The SUMIFS function won’t be the fastest or most efficient option for small datasets with few segments required, but as the volume of data and segmentations increases, SUMIFS becomes an invaluable tool.
The next time you’re dealing with large data sets, try using these handy Excel formulas to streamline your analysis.
