October 8, 2021
The Ideal QA Process in Digital Advertising
Facebook Analytics is a powerful tool available for free to advertisers, developers, and product managers to better understand the performance of their mobile apps and websites. However, it is often overlooked among the suite of available analytics solutions and as a result, presents an opportunity for its users to gain a competitive advantage over their peers when used as a complement to other analytics tools.
The biggest advantage that Facebook Analytics has over other analytics solutions is that it leverages Facebook’s ability to identify a specific user across devices and sessions to provide insights that better reflect an individual’s behavior. Other analytics solutions that lack Facebook’s cross-device tracking capabilities treat those actions from a single user as though they were multiple users.
Another great feature of Facebook Analytics is the ability to build accurate audience segments with the demographic information only available to Facebook. This differs from the guesswork that other analytics platforms use to identify the age, gender, and location of your users.
This post will cover how you can use these features of Facebook Analytics to optimize your user flow, and increase retention and customer lifetime value (LTV).
User behavior funnels are a common framework to analyze where users drop off in their journey to becoming a paying customer. You can find a funnel visualization tool in the Funnels screen of Facebook Analytics.
From here you can select “Create Funnel” to make your first funnel. In this wizard, we can select from the conversions you have defined via the Facebook Pixel or SDK by selecting “Add Funnel Step”. Select the conversions in the order in which they occur in your mobile app or website to get a proper view of each step in the customer journey. If you select the conversions in the incorrect order, no need to worry; you can easily rearrange the conversions you’ve selected by dragging and dropping them in the wizard.
Here is an example of this funnel analysis for an ecommerce website looking at user behavior from Page View, to Complete Registration, and then to Purchase:
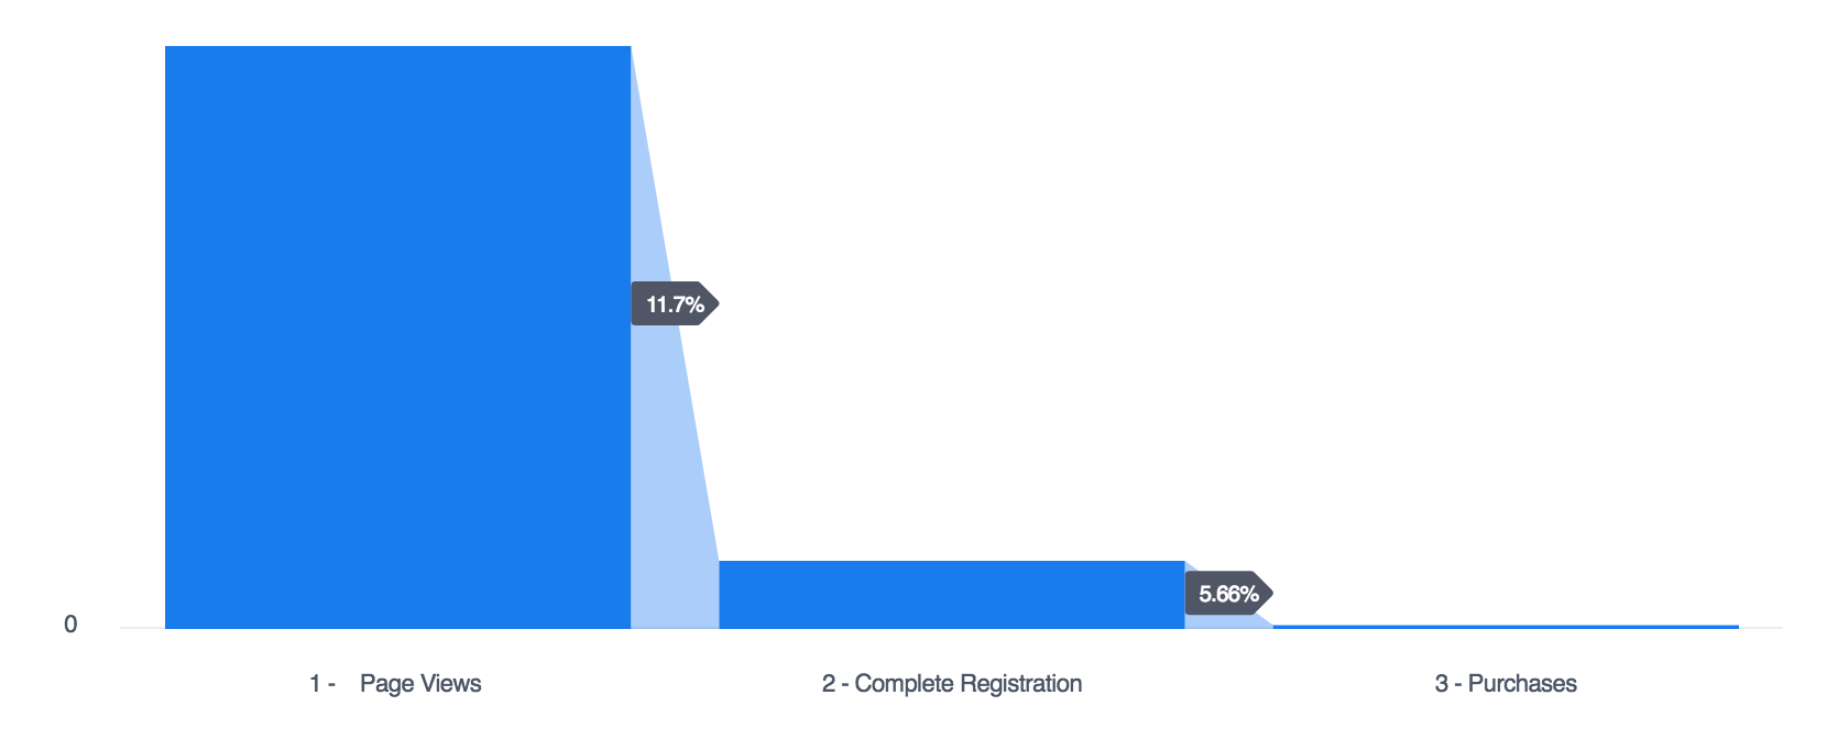
Image Provided by Facebook
The steep drop-off at each funnel step reflects opportunities for website optimizations to both the registration and purchase conversion flows to improve conversion rate and increase total conversions.
Another analysis you can perform in Facebook Analytics is cohort analysis, which allows you to isolate users by the day they first interacted with your mobile app or website and view their behavior over time. This allows you to answer two key business questions. First, do the new users that I acquire at various times continue to engage and use my product? Second, how much revenue do the new users generate as time progresses?
You can best explore the cohort analysis by selecting the Activity section and then the Cohorts screen. From here you select the “Create Cohort” button to begin using the wizard. The wizard will prompt you to select two events to determine how many users completed the first action one day and then completed the second action over a time period that you specify.
The example below shows this view for a mobile app install product for two events: App Installs and App Launches.

In this view, day 0 represents the day the user installed the app, day 1 represents the next day, and so on. With this view, you can see that a greater percent of users acquired on September 28th interacted with the app the day after they installed the app than users acquired any other day, and that this trend continued over the first 11 days after install. It may be worthwhile to examine if there was anything different about the audience targeted or product featured on September 28th versus the other days in this analysis.
Another way you can evaluate your audiences and products with cohort analysis is to try and estimate the customer lifetime value (LTV) of the customers you have acquired at various points in time. Understanding LTV is critical to successful marketing, as many businesses are willing to take a lower profit on the first purchase in order to drive repeat revenue and purchases over time. Cohort analyses allow you to see how much revenue your marketing drives over time.
To look at LTV data, adjust the second event selected to be an event that has revenue associated with it, such as a purchase, and adjust the dropdown that displays “User Retention” to display “Cumulative Values” instead. An example of this view is below:
You can then use this data in concert with your retention data to generate an estimate of LTV using a traditional LTV formula. We recommend looking at the average of monthly recurring revenue, multiply by your average customer lifetime, and multiply by your profit margin to generate this estimate. Below is an example of this method:
Average monthly recurring revenue = $5
Average customer lifetime = 18 months
Profit Margin = 20%
Average monthly recurring revenue x average customer lifetime x margin = Estimated LTV
$5 x 18 x 0.2 = $90 x 0.2 = $18
In this instance, while you can see your average monthly revenue from any day selected is $5, your acquisition efforts would be profitable at costs much higher, over 3x higher than the initial revenue recorded.
Facebook Analytics offers a number of opportunities to better understand your target audience and adjust your marketing goals to better meet them. Make it a regular reference in your digital marketing toolbox.
