October 8, 2021
The Ideal QA Process in Digital Advertising
How you segment paid search account data can have a major impact on how you view changes in account performance and what adjustments you make in response. A straightforward data pull of, say, this month’s performance compared to last month’s only provides you a general view of overall account health. You can evaluate some general ups and downs, but you really need to dig deeper to understand the trends that are impacting account performance.

Taking a little extra time to segment your data can tell you a lot about what’s going on in your accounts. Photo via Pexels.
When taking a look at the month-over-month data below, you would probably home in on the ROI decrease from 6 to 5. With just this data set to evaluate, you would probably assume that conversion rate and AOV (average order value) had dropped in Month 2, and that Month 2 is simply a weaker performing month. However, segmenting this data can give us a lot more insights, and will actually tell a larger story about account performance.

One of the easiest mistakes you can make is to evaluate combined data without breaking it down into Google vs Bing data. Bing is generally more volatile than Google. Even though Bing constitutes a smaller portion of spend, it can still cause big impacts, like driving down the overall ROI.

These findings should change your strategy for improving account efficiency and increasing overall ROI. In this situation, you would want to re-focus your efficiency efforts on Bing campaigns, or even reallocate spend from Bing to Google in future months.
The second most common mistake is to forget to separate out Brand data from overall numbers. Even though Brand typically accounts for a very small portion of total spend, it is often a huge contributor to overall revenue and ROI. One small drop in Branded traffic or conversion rate can make a huge difference to the bottom line.
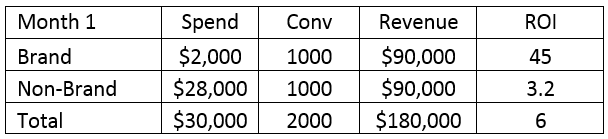

Separating Brand and Non-Brand for each month reveals that Non-Brand actually drove an increase in revenue and ROI! So instead of pulling back from Non-Brand efforts to improve ROI, you should focus on determining what caused a drop in Brand traffic and how to improve Brand performance in coming months.
Here are a couple of additional data segmentation strategies that can reveal surprising results:
There are many ways to segment data. Rather than making simple blanket conclusions based on overall data, take the time to segment your data in different ways and analyze trends in each segmentation – you might be surprised what you find!
