October 8, 2021
The Ideal QA Process in Digital Advertising
You are probably alarmed when you see one, two, or even three days of paid search account performance that doesn’t hit your goals. However, making optimization decisions based on too little data can cause longer-term declines in the account. The following two examples describe how you should react to a poor day or two of account performance, and how you can determine if you really should worry.

If your PPC accounts had a bad day, hitting the panic button might only make things worse. Image via Wikimedia Commons
For accounts with relatively low daily conversion volume (20 or fewer conversions per day), it’s important not to overreact to single day of below-average performance. Instead, take the time to place a bad day into the larger context of recent account history. In this example, I have a lead-gen account aiming to increase conversions with a CPL under $250. I come into the office on July 22 and check on performance for the previous day: only 1 conversion at a $1,097 CPL!
Your immediate reaction might be to cut bids drastically to spend way less and get closer to your CPA goal. But this would be the wrong conclusion from looking at just one day of data. What’s a more reasonable approach to take?
First, make sure nothing ran wildly amiss yesterday. Did conversion tracking break? Did a campaign spend way more than it should have? Did you change a setting that led to a major increase in spend?
Next, look at a larger time period, ideally of 30 days or greater. Have there been similar performance days in the past? How frequently? Was yesterday really an outlier, or just a “typical” bad day?
Looking back at the month of July in its entirety (in the following chart), you see a number of low-conversion days, and also several high-conversion days. Essentially, the high-conversion days balance out the low-conversion days to give us our daily average.
In the context of the entire month, our one-conversion day looks like a typical fluctuation. In fact, there have been several days with 0 conversions this month, but there have also been days with 4-8 conversions. By performing this quick analysis, you’ve saved yourself from making rash account management decisions based on a one-day fluctuation.

Of course, if you start to see trends within these fluctuations, like that weekends perform significantly worse than weekdays, you should pull data for a longer time period and make day-of-week bid adjustments to spend less on the poorer-performing days.
Those of us at agencies are frequently on the receiving end of client questions like “Performance is way down compared to last week—what’s wrong?”
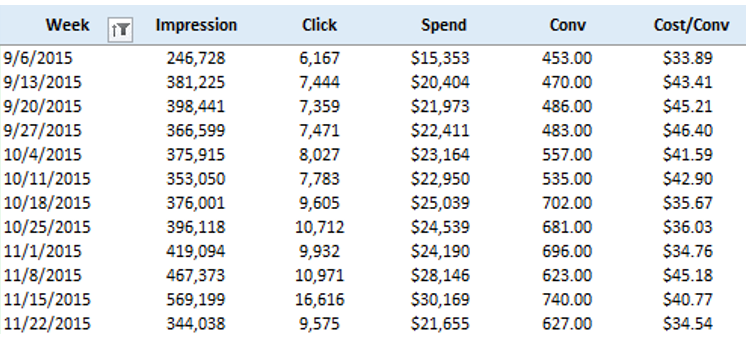
When looking at comparative data for such short date ranges, you need to measure against a normal week of account performance. If you look at just two consecutive weeks of data (in the charts below), you will see that conversions are undoubtedly down during the second week, with a 15% drop in conversions and a 28% drop in spend compared to the previous week.

However, looking at a more holistic time frame, you see that the week of 11/15 is the real anomaly in this situation, with an unusual surge in account spend and conversion volume. Performance isn’t down during the week of 11/22 — it’s just returning to its usual levels.
I’m not suggesting that you shouldn’t address abnormal account performance, but account changes should always be grounded in the best available data. Making data-focused decisions that will drive long-term performance requires enough data to identify and respond to actual trends. Taking the time to investigate short-term performance changes will allow you to optimize your paid search efforts for the long-haul.
