September 29, 2021
How to Improve Measurement with Cross-Domain Tracking
Over the last year, Google Analytics has rolled out more robust attribution modeling features to help advertisers understand the full digital conversion funnel. I’ve been surprised to see how few advertisers have adopted these new measurement tools. This post is meant to steer you away from the traditional last-click GA revenue model. Instead, examine the other GA attribution models and use them to gain a deeper understanding of your marketing funnel.
As a quick refresher, in Google Analytics’ main Acquisitions → Channels grid (for Metric Theory, this is effectively our GA home page), revenue is attributed to the channel that produced the last click before a conversion:
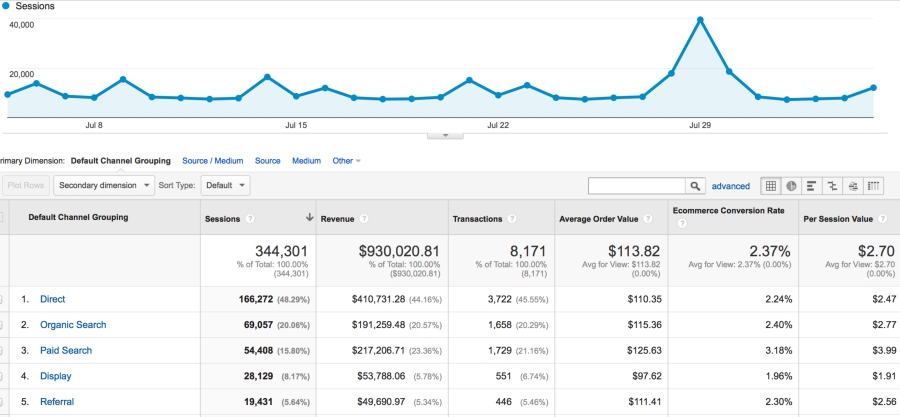
Unfortunately, we know that the digital conversion funnel is complex and is rarely limited to just one channel. Part of this complexity is that certain channels such as Direct, Organic Search, and branded Paid Search are much more likely to represent the final click in the conversion funnel and steal credit from other channels. They’re basically the kids who didn’t help at all on the group project in college, but came in and wrote the summary the night before it was due and presented the whole thing to the professor.
The reason that GA’s attribution modeling is a much more helpful starting point is that it provides a more accurate overview of what’s driving revenue for your business. GA has a number of different attribution models that spread credit over multiple interactions on the way to a conversion. Different models will make sense for different advertisers, but to start we recommend the Position-Based model. This assigns 40% credit to the first click, 40% to the last click, and splits the remaining 20% among the other clicks.
Let’s say someone clicks a paid search ad for your online widgets store, signs up for your email list, comes back to the site a second time via an email, and then finally makes a $100 widget purchase on a third trip after going directly to your site. GA’s default would be to assign $100 of revenue to Direct. A position-based model would allocate this as follows:

What does this look like in GA? Go to Conversions → Attribution → Model Comparison:

As a starting point, compare your “normal” last-click attribution model to the position-based model. GA will show you how much additional vs. less revenue each channel would be responsible for comparatively.
In the instance below, we’re looking at a last-click vs. position-based model for an ecommerce retailer. “Other advertising” refers to their affiliate programs.

As is almost always the case, Direct site revenue is overvalued. Consumers don’t inherently know to go to a specific site; they were usually introduced to that brand or company through an advertisement of some kind (online or offline), which led them to visit the site. In this instance, Paid Search, Organic Search, & Social Network (Facebook advertising), appear to be severely undervalued. If the individual controlling the marketing budgets is basing her decisions on the position-based attribution model, then it would likely make sense to invest further ad dollars into PPC and Facebook advertising.
Overall, it’s important to move away from last-click thinking, and the GA attribution models are a useful tool to start that process.
